Performs phylogenetic signal estimates evaluating uncertainty in trees topology.
tree_physig(
  trait.col,
  data,
  phy,
  n.tree = "all",
  method = "K",
  track = TRUE,
  ...
)
Arguments
| trait.col | The name of a column in the provided data frame with trait to be analyzed (e.g. "Body_mass"). |
|---|---|
| data | Data frame containing species traits with row names matching tips
in |
| phy | A phylogeny (class 'phylo') matching |
| n.tree | Number of times to repeat the analysis with n different trees picked
randomly in the multiPhylo file. (If |
| method | Method to compute signal: can be "K" or "lambda". |
| track | Print a report tracking function progress (default = TRUE) |
| ... | Further arguments to be passed to |
Value
The function tree_physig returns a list with the following
components:
Trait: Column name of the trait analysed
data: Original full dataset
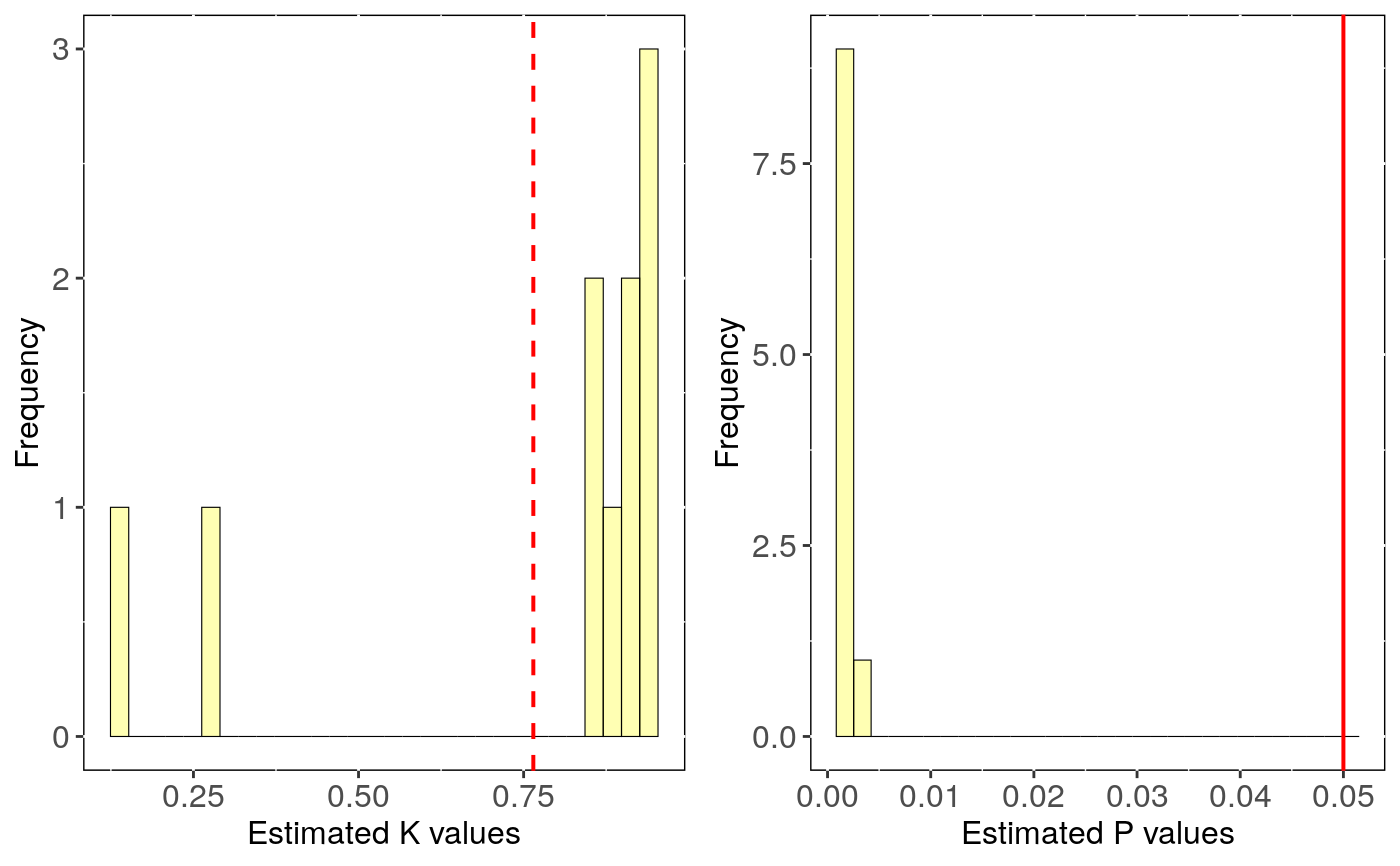
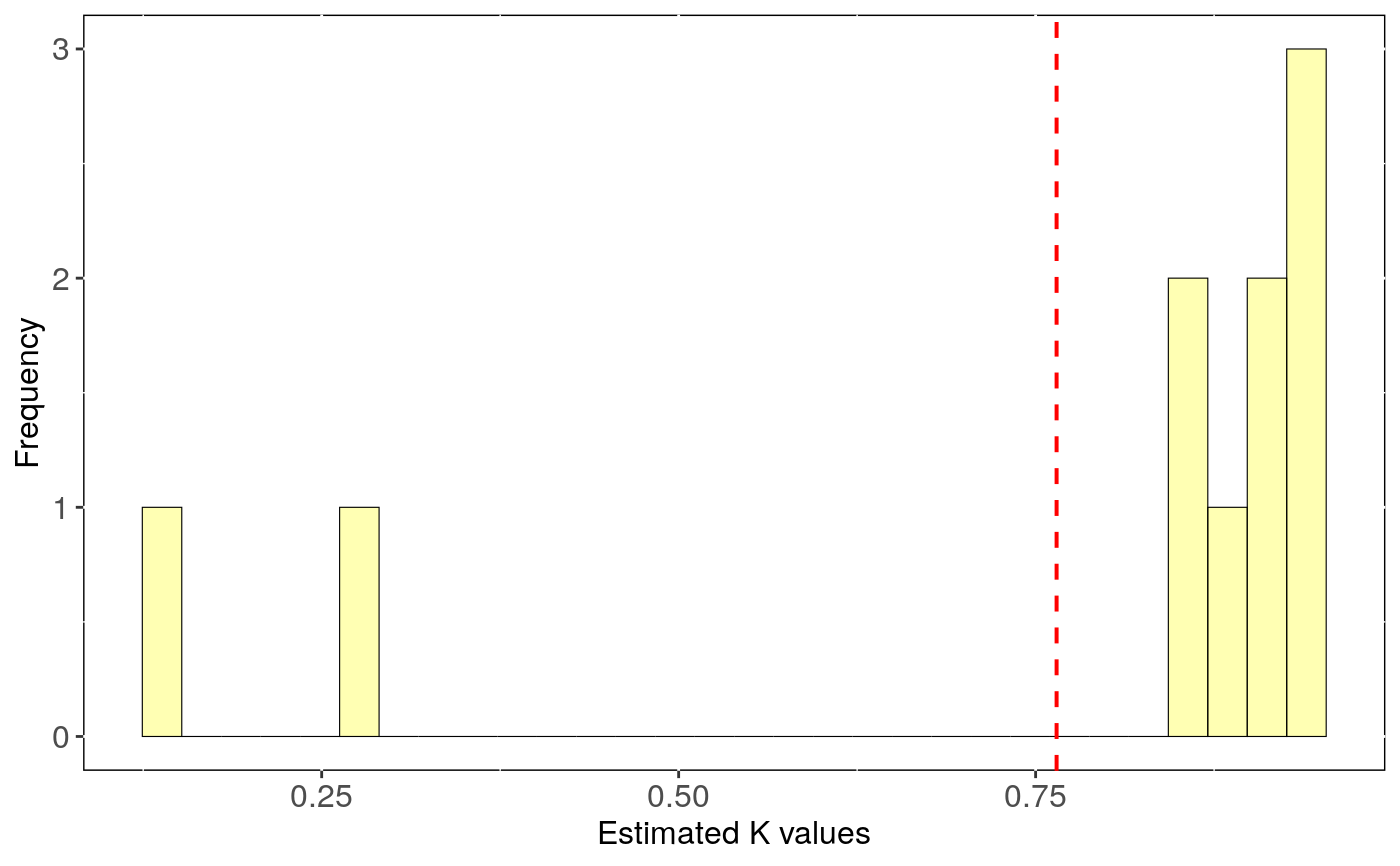
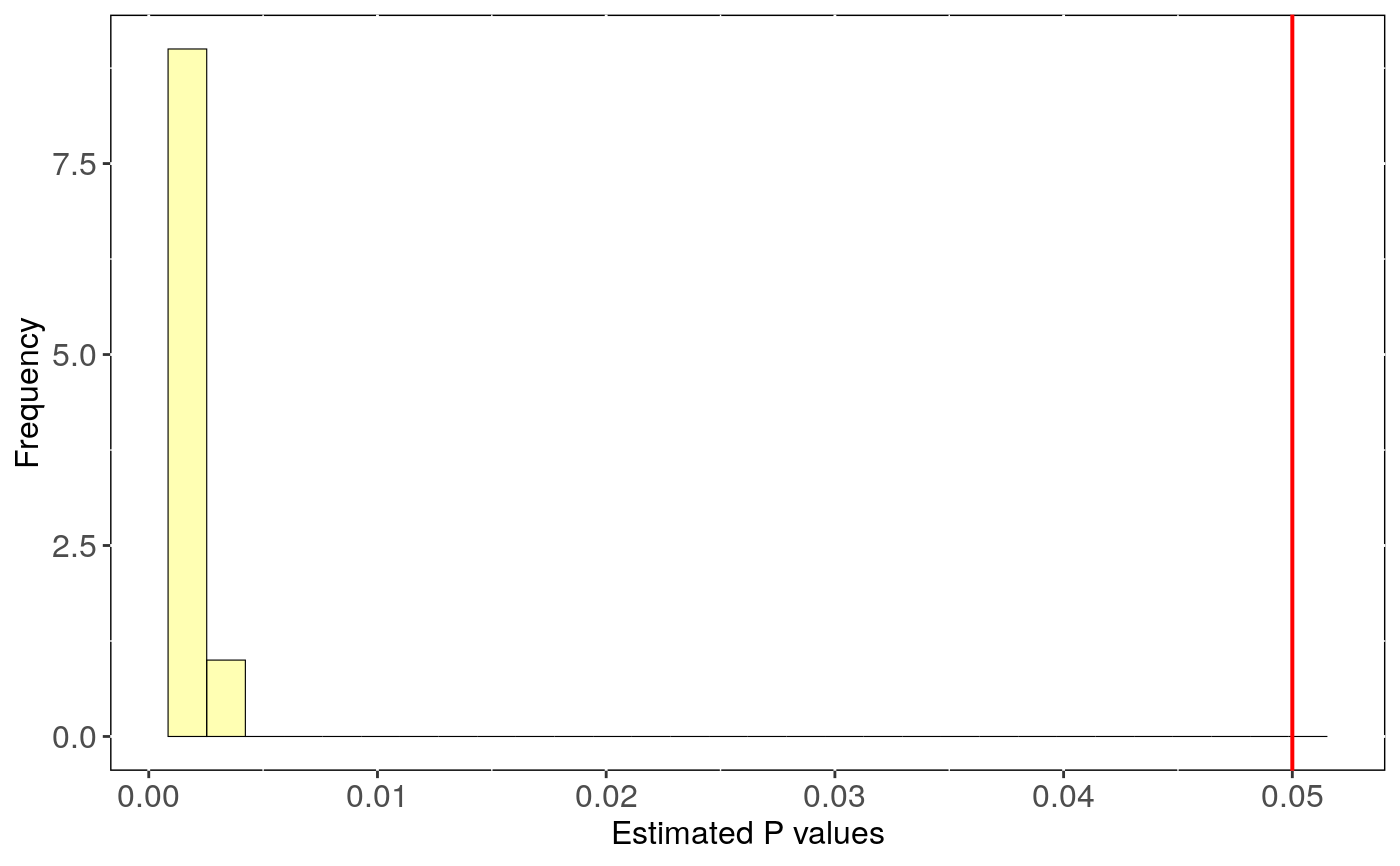
tree.physig.estimates: Three number, phylogenetic signal estimate
(lambda or K) and the p-value for each run with a different phylogenetic tree.
N.obs: Size of the dataset after matching it with tree tips and removing NA's.
stats: Main statistics for phylogenetic estimates.CI_low and CI_high are the lower
and upper limits of the 95
Details
This function estimates phylogenetic signal using phylosig
to n trees, randomly picked in a multiPhylo file.
Output can be visualised using sensi_plot.
Note
The argument "se" from phylosig is not available in this function. Use the
argument "V" instead with intra_physig to indicate the name of the column containing the standard
deviation or the standard error of the trait variable instead.
References
Paterno, G. B., Penone, C. Werner, G. D. A. sensiPhy: An r-package for sensitivity analysis in phylogenetic comparative methods. Methods in Ecology and Evolution 2018, 9(6):1461-1467
Donoghue, M.J. & Ackerly, D.D. (1996). Phylogenetic Uncertainties and Sensitivity Analyses in Comparative Biology. Philosophical Transactions: Biological Sciences, pp. 1241-1249.
Blomberg, S. P., T. Garland Jr., A. R. Ives (2003) Testing for phylogenetic signal in comparative data: Behavioral traits are more labile. Evolution, 57, 717-745.
Pagel, M. (1999) Inferring the historical patterns of biological evolution. Nature, 401, 877-884.
Kamilar, J. M., & Cooper, N. (2013). Phylogenetic signal in primate behaviour, ecology and life history. Philosophical Transactions of the Royal Society B: Biological Sciences, 368: 20120341.
See also
Examples
# Load data: data(alien) alien.data<-alien$data alien.phy<-alien$phy # Logtransform data alien.data$logMass <- log(alien.data$adultMass) # Run sensitivity analysis: tree <- tree_physig(trait.col = "logMass", data = alien.data, phy = alien.phy, n.tree = 10)#> Warning: NA's in response or predictor, rows with NA's were removed#> Warning: Some phylo tips do not match species in data (this can be due to NA removal) species were dropped from phylogeny or data#>#> | | | 0% | |======= | 10% | |============== | 20% | |===================== | 30% | |============================ | 40% | |=================================== | 50% | |========================================== | 60% | |================================================= | 70% | |======================================================== | 80% | |=============================================================== | 90% | |======================================================================| 100%summary(tree)#> $Call #> tree_physig(trait.col = "logMass", data = alien.data, phy = alien.phy, #> n.tree = 10) #> #> $Summary #> mean CI_low CI_high min max #> estimate 0.76469 0.55378 0.97560 0.14775 0.94925 #> pval 0.00120 0.00075 0.00165 0.00100 0.00300 #>sensi_plot(tree)#>#>