Performs Phylogenetic linear regression evaluating uncertainty in trees topology.
tree_phylm(formula, data, phy, n.tree = 2, model = "lambda", track = TRUE, ...)
Arguments
| formula | The model formula |
|---|---|
| data | Data frame containing species traits with species as row names. |
| phy | A phylogeny (class 'multiPhylo', see ? |
| n.tree | Number of times to repeat the analysis with n different trees picked
randomly in the multiPhylo file.
If NULL, |
| model | The phylogenetic model to use (see Details). Default is |
| track | Print a report tracking function progress (default = TRUE) |
| ... | Further arguments to be passed to |
Value
The function tree_phylm returns a list with the following
components:
formula: The formula
data: Original full dataset
sensi.estimates: Coefficients, aic and the optimised
value of the phylogenetic parameter (e.g. lambda) for each regression with a
different phylogenetic tree.
N.obs: Size of the dataset after matching it with tree tips and removing NA's.
stats: Main statistics for model parameters.CI_low and CI_high are the lower
and upper limits of the 95
all.stats: Complete statistics for model parameters. sd_intra is the standard deviation
due to intraspecific variation. CI_low and CI_high are the lower and upper limits
of the 95
Details
This function fits a phylogenetic linear regression model using phylolm
to n trees, randomly picked in a multiPhylo file.
All phylogenetic models from phylolm can be used, i.e. BM,
OUfixedRoot, OUrandomRoot, lambda, kappa,
delta, EB and trend. See ?phylolm for details.
Currently, this function can only implement simple linear models (i.e. \(trait~ predictor\)). In the future we will implement more complex models.
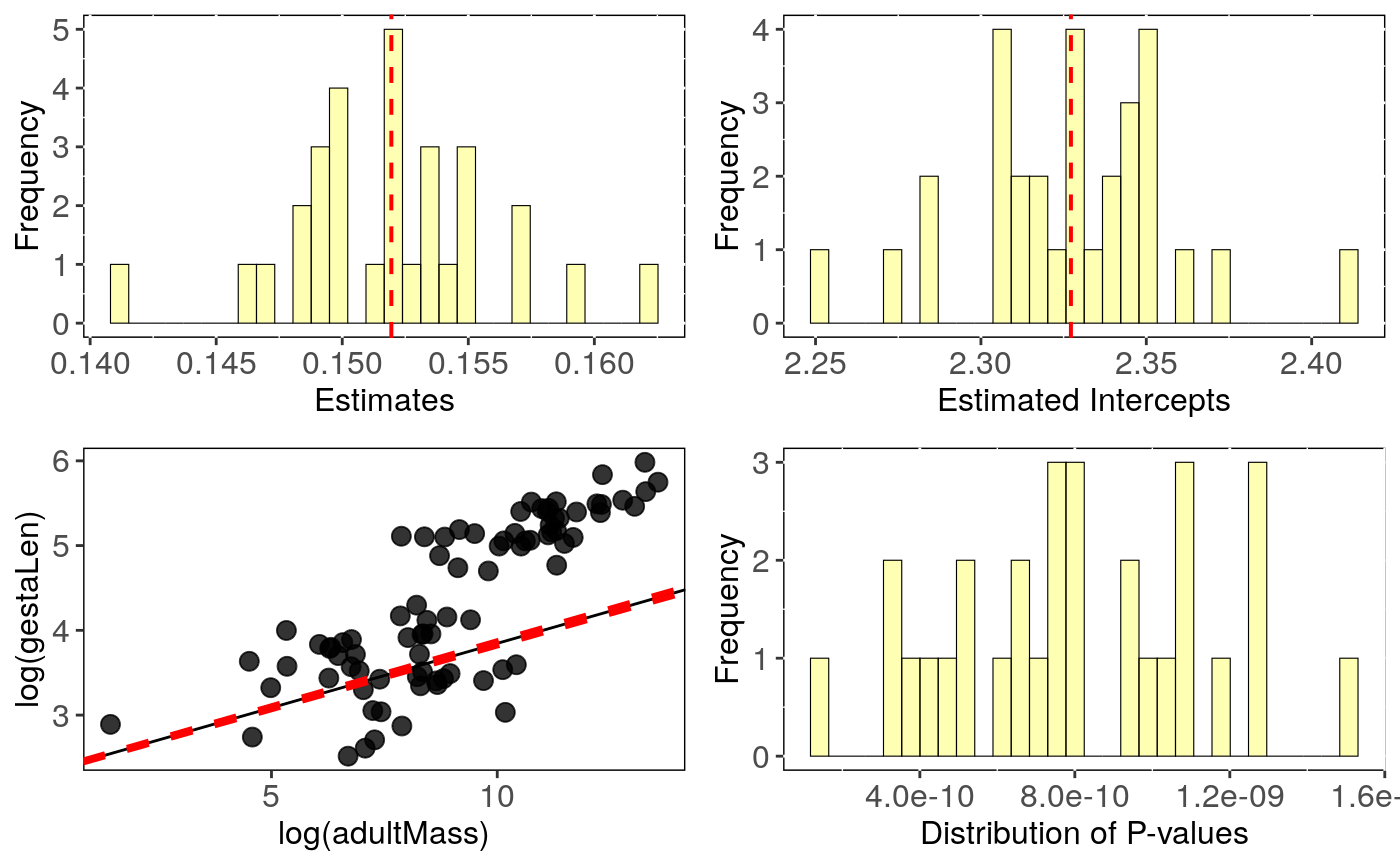
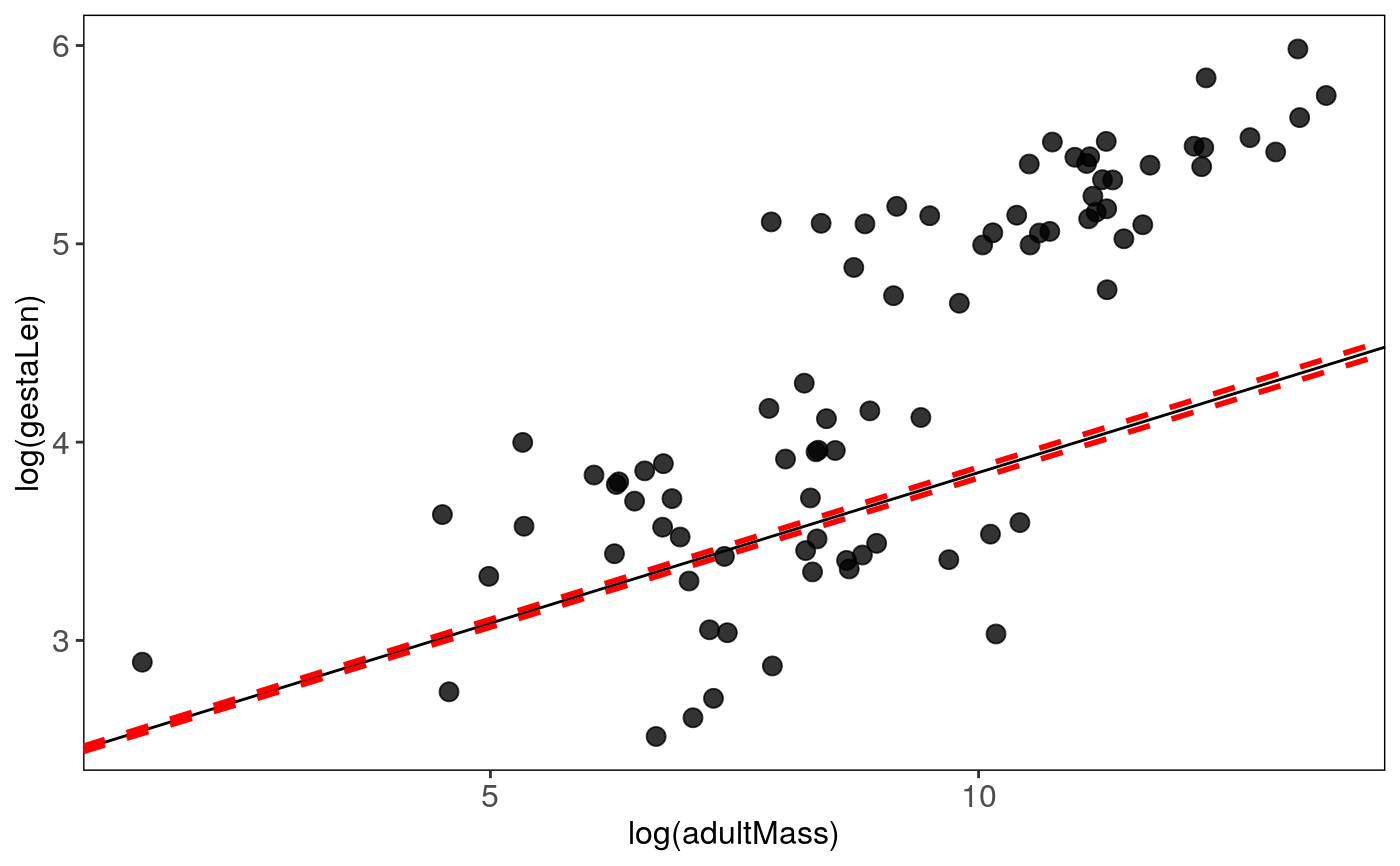
Output can be visualised using sensi_plot.
References
Paterno, G. B., Penone, C. Werner, G. D. A. sensiPhy: An r-package for sensitivity analysis in phylogenetic comparative methods. Methods in Ecology and Evolution 2018, 9(6):1461-1467
Donoghue, M.J. & Ackerly, D.D. (1996). Phylogenetic Uncertainties and Sensitivity Analyses in Comparative Biology. Philosophical Transactions: Biological Sciences, pp. 1241-1249.
Ho, L. S. T. and Ane, C. 2014. "A linear-time algorithm for Gaussian and non-Gaussian trait evolution models". Systematic Biology 63(3):397-408.
See also
Examples
#> [1] "multiPhylo"alien$phy#> 101 phylogenetic trees# run PGLS accounting for phylogenetic uncertain: tree <- tree_phylm(log(gestaLen) ~ log(adultMass), phy = alien$phy, data = alien$data, n.tree = 30)#> Warning: NA's in response or predictor, rows with NA's were removed#> Warning: Some phylo tips do not match species in data (this can be due to NA removal) species were dropped from phylogeny or data#>#> | | | 0% | |== | 3% | |===== | 7% | |======= | 10% | |========= | 13% | |============ | 17% | |============== | 20% | |================ | 23% | |=================== | 27% | |===================== | 30% | |======================= | 33% | |========================== | 37% | |============================ | 40% | |============================== | 43% | |================================= | 47% | |=================================== | 50% | |===================================== | 53% | |======================================== | 57% | |========================================== | 60% | |============================================ | 63% | |=============================================== | 67% | |================================================= | 70% | |=================================================== | 73% | |====================================================== | 77% | |======================================================== | 80% | |========================================================== | 83% | |============================================================= | 87% | |=============================================================== | 90% | |================================================================= | 93% | |==================================================================== | 97% | |======================================================================| 100%#> mean CI_low CI_high #> intercept 2.327 2.315 2.339 #> se.intercept 0.343 0.342 0.344 #> pval.intercept 0.000 0.000 0.000 #> estimate 0.152 0.150 0.153 #> se.estimate 0.022 0.022 0.022 #> pval.estimate 0.000 0.000 0.000